
Topic: Patterns Of Change
Patterns Of Change
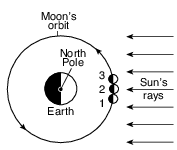
The photographs below show two celestial objects just before, during, and just after a total solar eclipse as viewed by an observer located in Kingston, Tennessee, on August 21, 2017.

Which diagram represents the location of the Moon in its orbit at the time that each of these three photographs (1, 2, and 3) were taken? (Diagrams are not drawn to scale.)
(1) 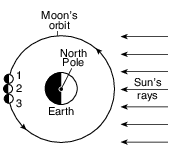
(2) 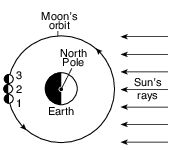
(3) 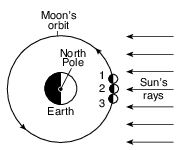
(4) 
The diagram below represents Earth in four positions, labeled A, B, C, and D, in its orbit around the Sun on the first day of each season.
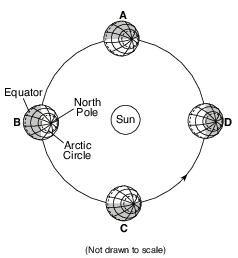
Between which two consecutive positions is the summer season occurring in the Northern Hemisphere?
(1) A and B
(2) B and C
(3) C and D
(4) D and A
While studying sediments deposited during and after the last ice age, scientists discovered that foraminiferid shells coil in different directions when they grow under different temperature conditions, as shown in the diagram below.

Foraminiferid shells found in layer X most likely coiled to the
(1) right, because water temperatures were cool
(2) right, because water temperatures were warm
(3) left, because water temperatures were cool
(4) left, because water temperatures were warm
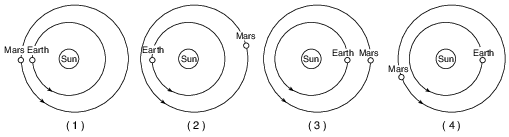
The diagram below shows the relative positions of Earth and Mars in their orbits on a particular date during the winter of 2007.

Which diagram correctly shows the locations of Earth and Mars on the same date during the winter of 2008?
(1) 1
(2) 2
(3) 3
(4) 4
The map below shows two seasonal positions of the polar front jet stream over North America.
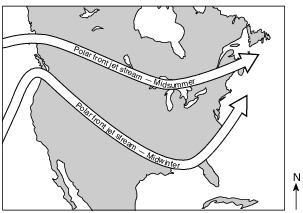
Which statement best explains why the position of the polar front jet stream varies with the seasons?
(1) Rising air compresses and cools in winter.
(2) Water heats and cools more rapidly than land in winter.
(3) Prevailing winds reverse direction in summer.
(4) The vertical rays of the Sun shift north of the equator in summer.
A cross section of Niagara Falls is shown below.
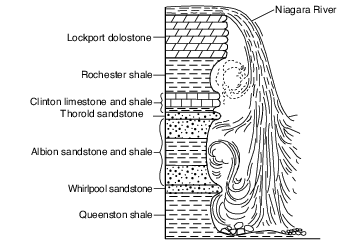
Which two rock units appear to be most resistant to weathering and erosion?
(1) Lockport dolostone and Whirlpool sandstone
(2) Rochester shale and Albion sandstone and shale
(3) Clinton limestone and shale and Queenston shale
(4) Thorold sandstone and Queenston shale
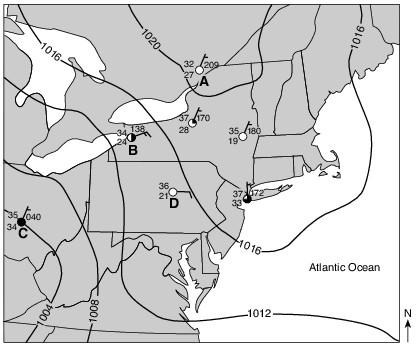
What was the probable air pressure, in millibars, at station D?
(1) 1015.0 mb
(2) 1017.0 mb
(3) 1021.0 mb
(4) 1036.0 mb
During which Northern Hemisphere season is Earth closest to the Sun?
(1) spring
(2) summer
(3) autumn
(4) winter
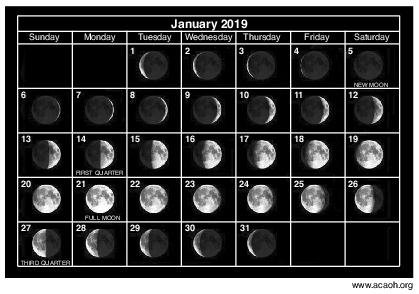
In image below, circle the position of the Moon in its orbit that produced the moon phase observed on January 17, 2019. [1]

Allow 1 credit for circling only the position shown in the example below.
Carrara Marble
Carrara marble is named for the town of Carrara on the west coast of Italy. This dazzling white marble has been mined since the time of the ancient Romans and remains the major industry of the area today. The marble has many commercial uses, such as tombstones, countertops, tiles, and building stones. Its chemical purity, uniform color, and hardness make this marble an ideal material for artists who carve statues from rock. Major museums around the world have statues carved from Carrara marble.
The formation of Carrara marble began 200 million years ago when a great thickness of tiny shells was deposited at the bottom of a warm, shallow sea. Over time, burial and compaction of these sediments formed sedimentary rock primarily composed of pure calcite. Approximately 27 million years ago, tectonic forces caused this area of the seafloor bedrock to be deformed and metamorphosed, forming the Carrara marble. Uplift and erosion later exposed huge formations of this famous marble.
Identify the change in pressure and the change in temperature that most likely occurred to metamorphose the sedimentary seafloor bedrock into the Carrara marble. [1]
Change in pressure: Change in temperature:
Allow 1 credit if both responses indicate an increase.
• Change in pressure:
• — increase
• — higher/greater
• Change in temperature:
• — increase
• — hotter
• — higher
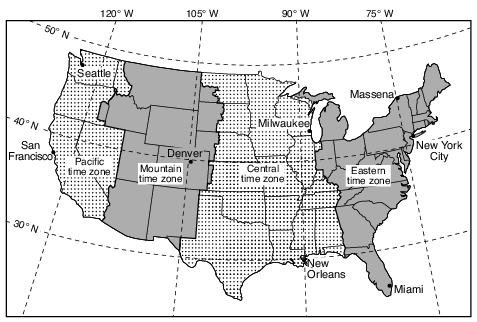
State the time at San Francisco, California, when it is 12 noon at New Orleans, Louisiana. Indicate a.m. or p.m. in your answer. [1]
Allow 1 credit. Acceptable responses include, but are not limited to:
• — 10:00 a.m.
• — 10 am
• — 1000 (military time)
• — 10 in the morning

Describe how the rocks and sediments are rounded and smoothed as they are being eroded by the water in this river. [1]
Allow 1 credit. Acceptable responses include, but are not limited to:
• — Rocks are rounded by tumbling and having sharp corners wear down or break off.
• — weathering by abrading with other sediments or against the streambed
• — Abrasion polishes and shapes rocks.
• — by scraping, bouncing, and rolling along
• — by colliding with other particles in the water
• Note: Do not allow credit for “water” or “erosion” acting alone because water alone, without
• sediments, does not abrade rock, and erosion is restating the question.. Do not allow credit for “weathering” alone because this term is too general and does not describe how sediments are rounded and smoothed.

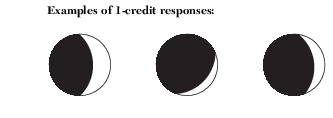
On the diagram in the image provided, shade the portion of the Moon that is in darkness as viewed from New York State when the Moon is at position 1. [1]

Allow 1 credit if the student shades more than half of the Moon, leaving a lighted portion on the right edge as shown below.
• 
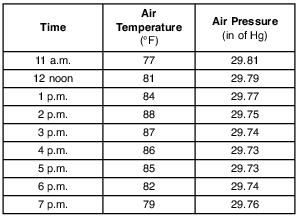
State the relationship between air temperature and air pressure from 11 a.m. to 2 p.m. [1]
Allow 1 credit. Acceptable responses include, but are not limited to:
• — As temperature increased, pressure decreased.
• — There is an inverse relationship between air temperature and air pressure.
• — As one variable increases, the other variable decreases.
A student was interested in how the angle of insolation affects absorption of radiation. The student took three black metal plates, each containing a built-in thermometer, and placed them at the same distance from three identical lamps. The plates were tilted so that the light from the lamps created three different angles of incidence with the center of the plates, as shown in the diagram. The starting temperatures of the plates were recorded. The lamps were turned on for 10 minutes. Then the final temperatures were recorded.
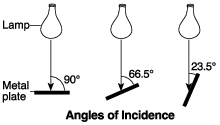
The metal plate at a 90° angle of incidence represents a location on Earth at solar noon on March 21. What is the latitude of this location? [1]
Allow 1 credit for 0° latitude or the equator.